
|
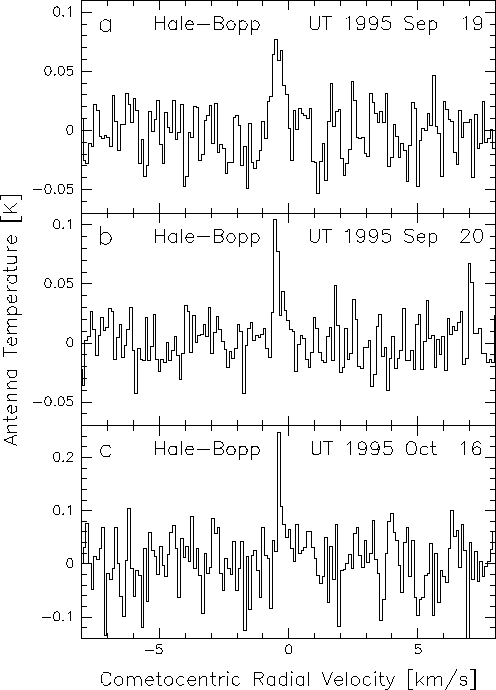
Spectra of the 230 GHz CO[2-1] rotational emission line in comet Hale-Bopp. The line appears blue-shifted relative to the instantaneous radial velocity of the comet by about 350 m/s. The blue-shift results from sunward ejection of the carbon monoxide in response to solar heating of the nucleus. The area of the line corresponds to a CO production rate of about 1000 kg/s (1 tonne/s).
The gross properties of the line are very similar to those observed earlier in comet P/Schwassmann-Wachmann 1. The activity of both comets, at distances ~6 AU from the sun, is readily explained by the outgassing of CO. At 6AU, any water ice in the nuclei will be frozen solid, and cannot contribute to the observed cometary activity. The orbit of P/SW1 is nearly circular, giving no opportunity for the comet to be heated enough for water to ever sublimate. The orbit of Hale-Bopp is highly elliptical. Inside 3 AU, water production exceeds CO.
As can be seen below, the tiny CO line observed first in 1995 September as grown to a bright line by early 1997. In fact, the gas production has increased faster than the ratio of the line areas would suggest. When close to the sun, the rotational levels of the CO molecule that are most densely populated are higher than the 3-2 transition observed here. Paradoxically, we can expect to see a decrease in the CO line strength as the comet nears the sun and heats up. Such a decrease was indeed observed in C/Hyakutake at R < 1 AU.
The spectra were taken at the James Clerk Maxwell Telescope on Mauna Kea, using its "A2" receiver.
Reference: Jewitt, Senay and Matthews, (1996), SCIENCE, 271, 1110-1113.

|
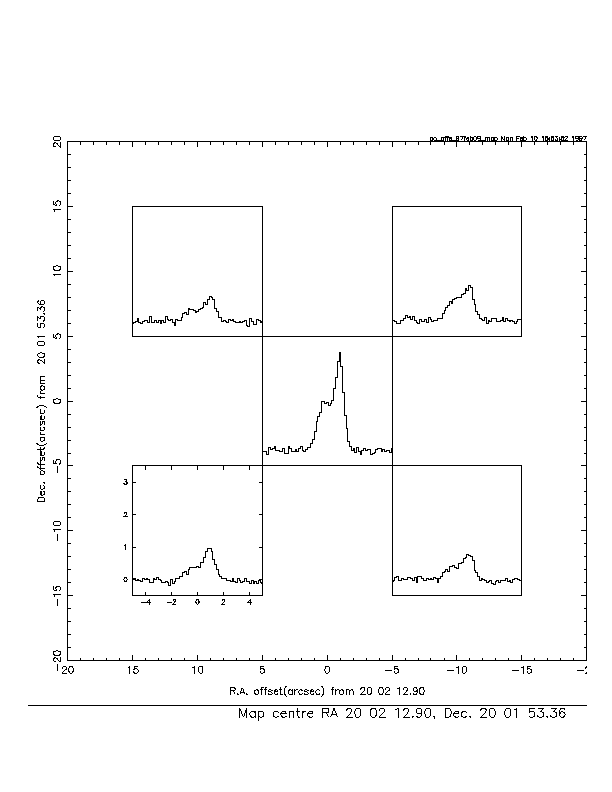
Growth of the CO(3-2) line has been monitored as Hale-Bopp approaches the sun. By early 1997, the CO line was so bright that limited mapping became possible. The figure at left shows the CO line at the center of the comet, and at 4 positions offset from the center by 10 arcsec in both RA and DEC. Variations in the line strength and shape reflect physical processes in the coma, especially the velocity field of the outflowing coma gases.
A temperature scale is shown on the lower left panel. The central CO has TA = 3 K, or 40 times brighter than the "discovery" spectrum shown above.
These spectra were taken UT 1997 Feb 09, by Henry Matthews.

| ||
| Hale-Bopp | Submillimeter | Jewitt |
|---|
Last Updated February 1997