Active Longitudes Revealed by Large-scale and Long-lived Coronal Streamers
Jing Li (UCLA)
Astrophysical Journal, 735, 130, 2011 July 10
Abstract
We use time-series ultraviolet full sun images to construct limb-synoptic maps of the Sun. On these maps, large-scale, long-lived coronal streamers appear as repetitive sinusoid-like arcs projected over the polar regions. They are caused by high altitude plasma produced from sunspot-rich regions at latitudes generally far from the poles. The non-uniform longitudinal distribution of these reveals four longitudinal zones at the surface of the sun from which sunspots erupt preferentially over the 5-year observing interval (2006 January to 2011 April). Spots in these zones (or ``clusters'') have individual lifetimes short compared to the lifetimes of the coronal features which they sustain, and erupt at different times. The four sunspot clusters contain >75% of all numbered sunspots in this period. They occupy two distinct longitudinal zones separated by ~180˚ and each spanning ~100˚ in longitude. The rotation rates of the spot clusters are 5% faster than the rates at both the surface and the bottom of the convection zone. While no convincing theoretical framework exists to interpret the sunspot clusters in the longitude-time space, their persistent and nonuniform distribution indicates long-lived, azimuthal structures beneath the surface, and are compatible with the existence of previously-reported active longitudes on the sun.
Large-scale Coronal Streamers
On individual images, large coronal streamers extending from active regions are best seen at soft X-ray wavelengths (see Figure 2 of ApJ...565.1289L or the movie). Panels on the right are images taken with EUVI/STEREO A in 195 Å. The visibility of the polar hole varies with locations of active regions. Active regions appear (a) on the east limb, (b) disk center, (c) the west limb and (d) the far side of the sun.
Long-lived Coronal Streamers
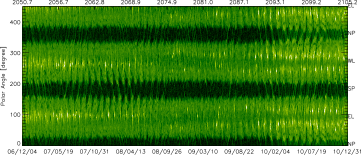
Full coronal limb synoptic maps (LSM) best demonstrates the long-lived coronal streamers appearing as diagonal streaks crossing over the polar holes. These streamers connect to more equatorial active regions (see). They have lifetimes longer than typical sunspots because they are replenished by the continuous emergence of active regions in the photosphere.
Sunspots Grouped by Large-scale, Long-lived Coronal Streamers
The appearance of the long-lived coronal streamers on LSMs reflects non-uniform longitudinal distributions of the sunspot active regions on the sun. By tracing these streamers on LSM, responsible sunspot groups can be identified (also see).
Sunspot Cluster in Carrington Longitude-Time Space
Carrington longitudes of sunspots as function of time between 2006 January 1 and 2011 April 15. Members of non-contemporaneous spot clusters are plotted in colored ``+''. The linear regression fits of Carrington longitudes and +/-25˚ of the fits are drawn with colored straight and dotted lines. The Carrington longitudes of some sunspots have been added or subtracted by 360˚ to avoid artificial roll over from 360˚ to 0˚ within a cluster. The vertical straight line drawn at DOY=998 (2008 September 24) separates the cycle 23 from 24. The sunspot groups found having no clear affiliation with any clusters using long-lived streamers are marked with black ``+''.
Assuming All Numbered Sunspots Emerged on 2006 January 1
All sunspot groups affiliated with non-contemporaneous spot clusters between 2006 January 1 and 2011 April 11 are plotted with their Carrington latitudes against longitudes. Their longitudes have been shifted as if they all emerged on 2006 January 1. Within each spot cluster, sunspot groups emerging before DOY 998 (2008 September 24) are plotted with “diamonds”, those emerging after DOY 998 are plotted with “x”.
Non-Uniform Distribution of Sunspot Groups on the Sun
Sunspot longitudinal histogram. The sunspot longitudes have been shifted as if all sunspots emerged on 2006 January 1.
Last updated Thu Jun 7 2012


