Long-Term Measurements of Sunspot Magnetic Tilt Angles

Abstract
Tilt angles of close to 30,600 sunspots are determined using Mount Wilson daily averaged magnetograms taken from 1974 to 2012, and MDI/SoHO magnetograms taken from 1996 to 2010. Within a cycle, more than 90% of sunspots have a normal polarity alignment along the east-west direction following Hale's law. The median tilts increase with increasing latitude (Joy's law) at a rate of ~0.5 degree per degree of latitude. Tilt angles of spots appear largely invariant with respect to time at a given latitude, but they decrease by ~0.9 degree per year on average, a trend which largely reflects Joy's law following the butterfly diagram. We find an asymmetry between the hemispheres in the mean tilt angles.  On average, the tilts are greater in the southern than in the northern hemisphere for all latitude zones, and the differences increase with increasing latitude.

Data

The data used in this study consist of sunspot daily records and longitudinal magnetograms. For the period 1974 to 1990, we use the sunspot records made at MWO. From 1991 onward, the sunspot reports were prepared by Space Weather Forecast Center (SWFC) from observations made by MWO and other observatories.


Method

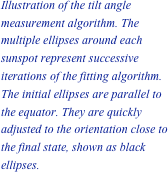
The tilt angle measurements are performed by an automated IDL package which accomplishes the following tasks: (a) locate the sunspots on the magnetograms; (b) determine the centroids of the entire sunspot, positive and negative polarities within each spot; and (c) calculate the tilt angles for each sunspot group. Once the sunspot locations and sizes were initially determined,  the automated IDL program runs an iteration of tasks (b) and (c) until the tilt angle converges or stabilizes.
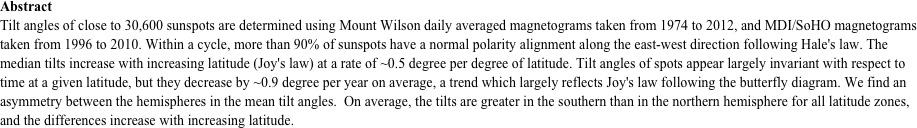
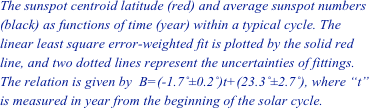
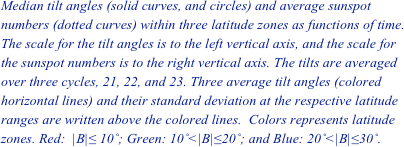
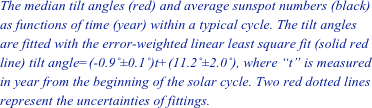

Results

Illustration of the tilt angle measurement algorithm. The multiple ellipses around each sunspot represent successive iterations of the fitting algorithm. The initial ellipses are parallel to the equator. They are quickly adjusted to the orientation close to the final state, shown as black ellipses.
Hale’s Law between 1974 to 2012. The time spans from the end of cycle 20 to the beginning of cycle 24, and is marked in year. The horizontal line represents the equator. Red dots represent sunspots in the northern hemisphere, and blue dots represent those in the southern hemisphere.
Joy’s Law between 1974 to 2012. 

Sunspot tilt angle distribution in northern (red lines) and southern (blue lines) hemispheres within four latitude ranges. The histogram bin size is 5-degree. The vertical straight lines mark the 0 degree tilt angle.
Joy’s Law: Circles and solid curve represent median tilt angles of all 30,600 sunspots. The vertical bars represent uncertainties. The solid and dotted red lines are the linear least square fits to the data points and their uncertainties respectively. Joy's law is expressed as tilt angle =(0.5˚±0.2˚)B-(0.9˚±0.3˚), where B is the latitude degree.
Sunspot tilt angles overlap with butterfly diagram. The latitudes are scaled in the left vertical axis, and the tilt angles are scaled in the right vertical axis. The horizontal straight line indicate the latitude and tilt angle 0 degree.
The sunspot centroid latitude (red) and average sunspot numbers (black) as functions of time (year) within a typical cycle. The linear least square error-weighted fit is plotted by the solid red line, and two dotted lines represent the uncertainties of fittings. The relation is given by  B=(-1.7˚±0.2˚)t+(23.3˚±2.7˚), where “t” is measured in year from the beginning of the solar cycle.
Median tilt angles (solid curves, and circles) and average sunspot numbers (dotted curves) within three latitude zones as functions of time. The scale for the tilt angles is to the left vertical axis, and the scale for the sunspot numbers is to the right vertical axis. The tilts are averaged over three cycles, 21, 22, and 23. Three average tilt angles (colored horizontal lines) and their standard deviation at the respective latitude ranges are written above the colored lines.  Colors represents latitude zones. Red:  |B|≤ 10˚; Green: 10˚<|B|≤20˚; and Blue: 20˚<|B|≤30˚.

The median tilt angles (red) and average sunspot numbers (black) as functions of time (year) within a typical cycle. The tilt angles are fitted with the error-weighted linear least square fit (solid red line) tilt angle=(-0.9˚±0.1˚)t+(11.2˚±2.0˚), where “t” is measured in year from the beginning of the solar cycle. Two red dotted lines represent the uncertainties of fittings.

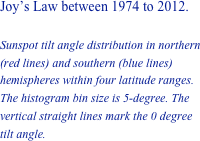
last updated  Tue Oct  9 11:08:45 PDT 2012