Abstract
We present a study of planet-crossing asteroid (3200) Phaethon at three successive perihelia in 2009, 2010 and 2012, using the NASA STEREO spacecraft. Phaethon is clearly detected in 2009 and 2012, but not in 2010. In both former years, Phaethon brightened unexpectedly by ~1 magnitude at large phase angles, inconsistent with the ~1 magnitude of steady fading expected from a discrete, macroscopic body over the same phase angle range. With a perihelion distance of 0.14 AU and surface temperatures up to ~1000 K, a thermal origin of this anomalous brightening is strongly suspected. However, simple thermal emission from Phaethon is too weak, by a factor 1000, to explain the brightening. Neither can ice survive on this body, ruling out comet-like sublimation. Our preferred explanation is that brightening occurs as a result of dust produced and ejected from Phaethon, perhaps by thermal fracture and/or thermal decomposition of surface minerals when near perihelion. A contribution from prompt emission by oxygen released by desiccation of surface minerals cannot be excluded. We infer an ejected mass of order 4x10^8 a_mm kg per outburst, where a_mm is the mean dust radius in millimeters. For plausible dust radii, this mass is small compared to the estimated mass of Phaethon (~2x10^14 kg) and to the mass of the Geminid stream (10^12 kg to 10^13 kg) with which Phaethon is dynamically associated. Perihelion mass-loss events like those observed in 2009 and 2012 contribute to, but do not necessarily account for the Geminids stream mass.
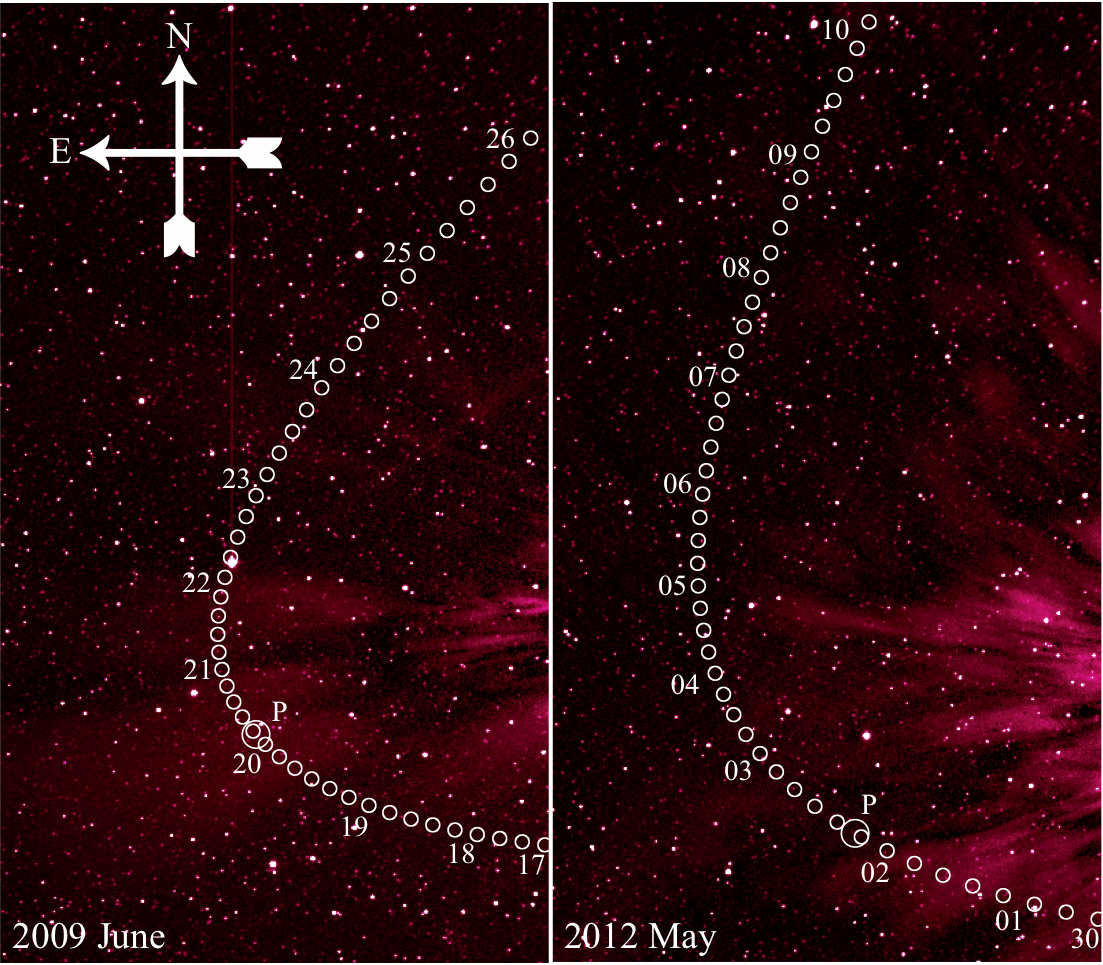
Phaethon Trajectories on the STEREO A HI-1 Images
The path of Phaethon (white circles) across the field of view of the STEREO A HI-1 camera in 2009 (left) and 2012 (right). Numbers along the path show the day of the month. The perihelia are indicated with the letter ``P'' and a large circle. The sun is on the right. The images were taken on the dates when Phaethon was at the perihelion. Both panels show 400x700 pixels (7.8˚x13.6˚).
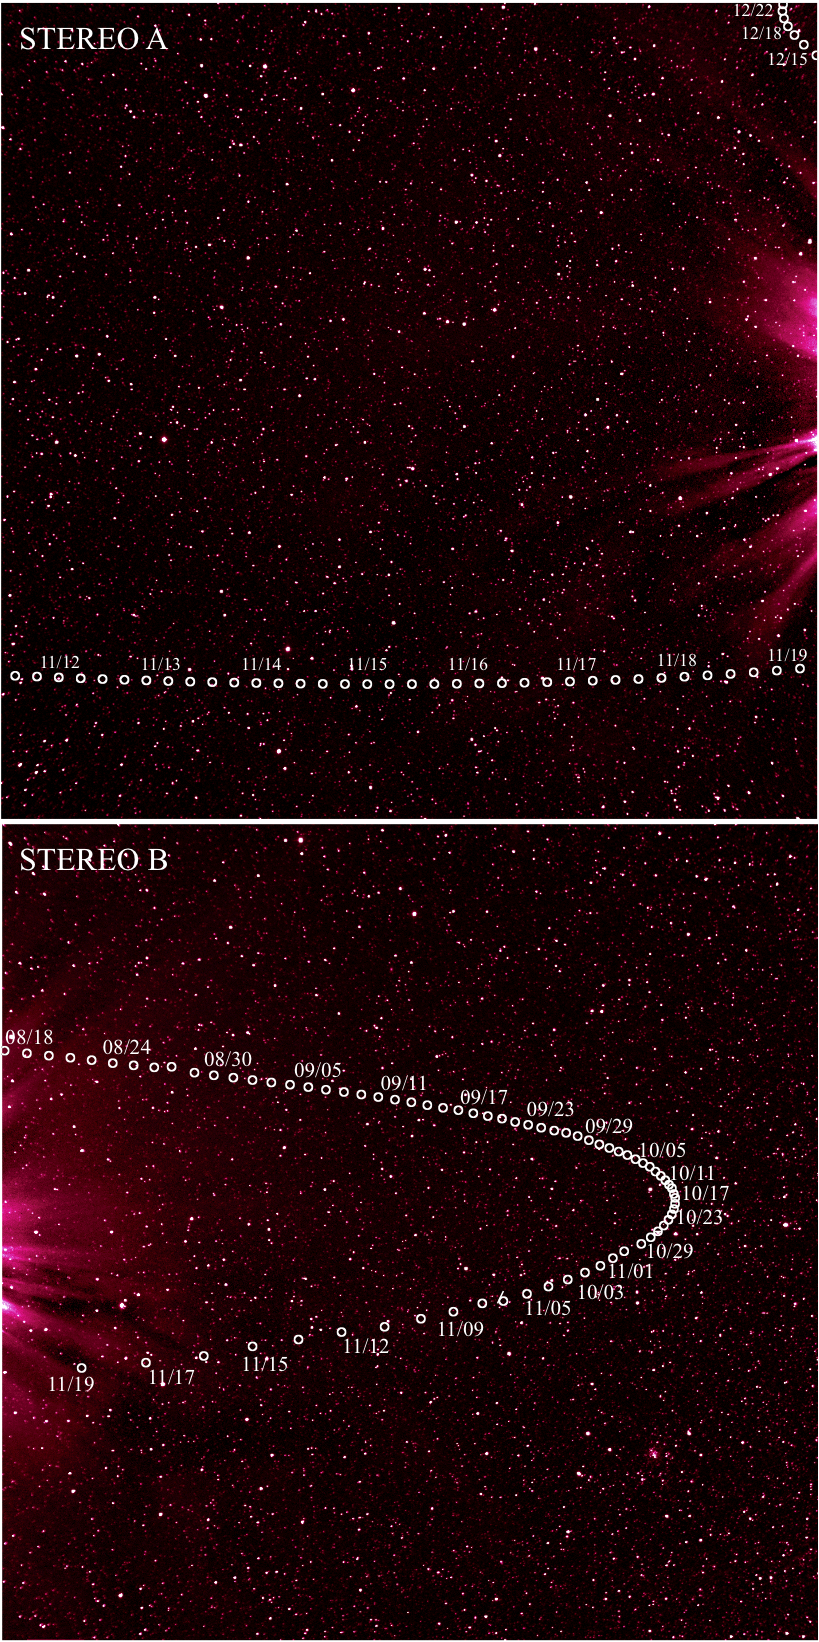
The path of Phaethon (white circles) across the STEREO A (upper) and B (lower) HI-1 fields of view in 2010. Numbers along the path show the date in month/day format. Perihelion occurred on UT 2010 November 25 18:00, at which time Phaethon was not within the field of either STEREO camera. Panels show the full size HI-1 images of 20˚x20˚. The sun is on the right in the upper panel, and on the left in the lower panel.
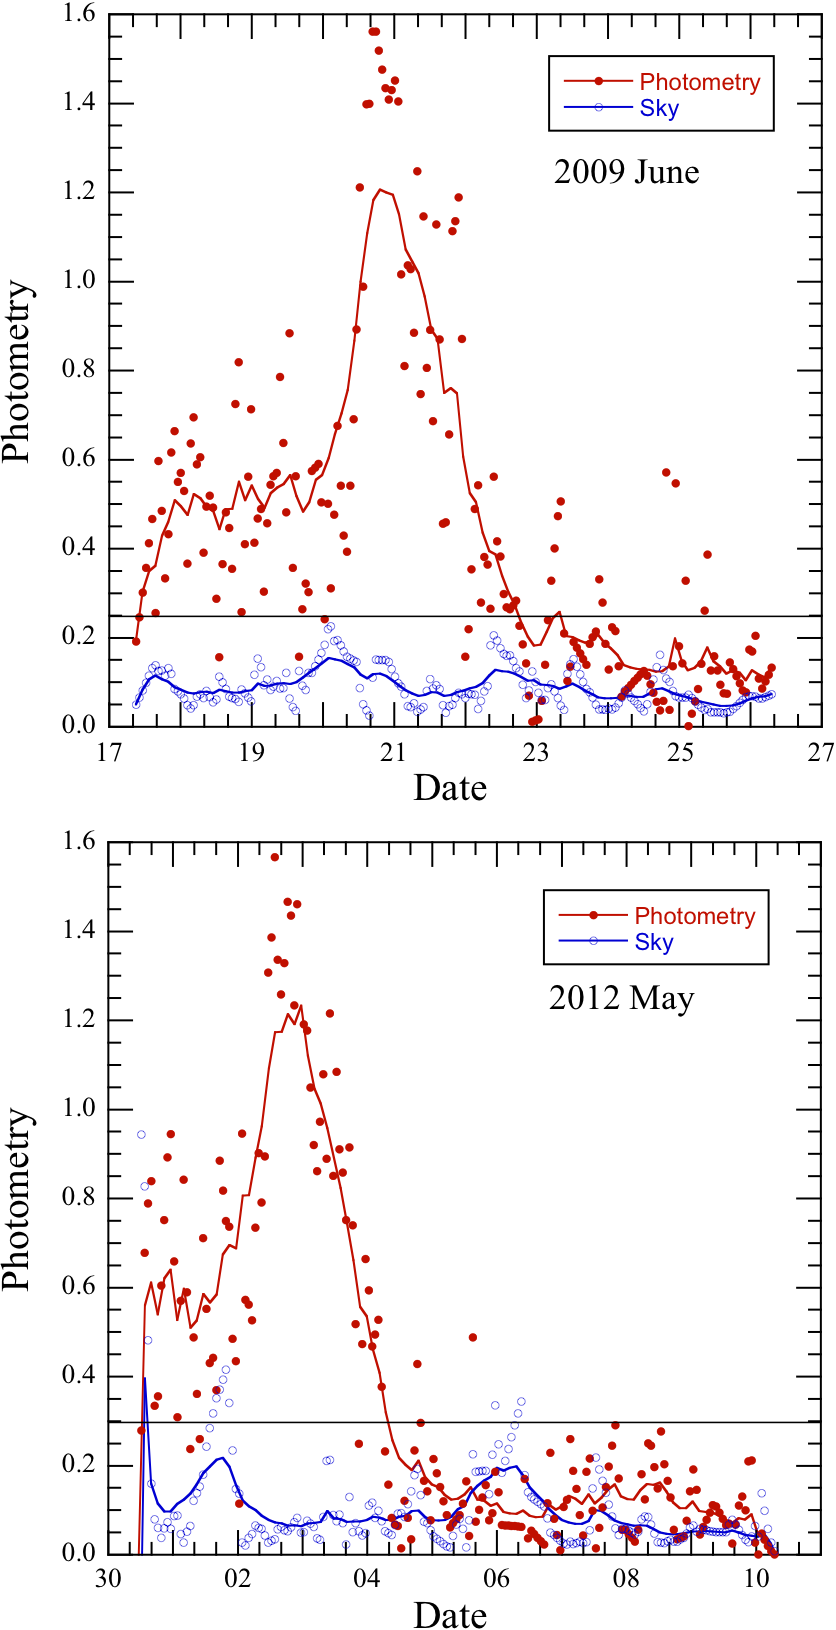

Raw photometry of Phaethon (red circles) as a function of time near perihelion in 2009 and 2012. The median sky brightness surrounding Phaethon is shown with blue circles. Smoothed curves (red and blue lines) have been plotted to guide the eye. Horizontal lines represent the photometry thresholds that are three times of the sky mean. Above the levels, Phaethon was detected.
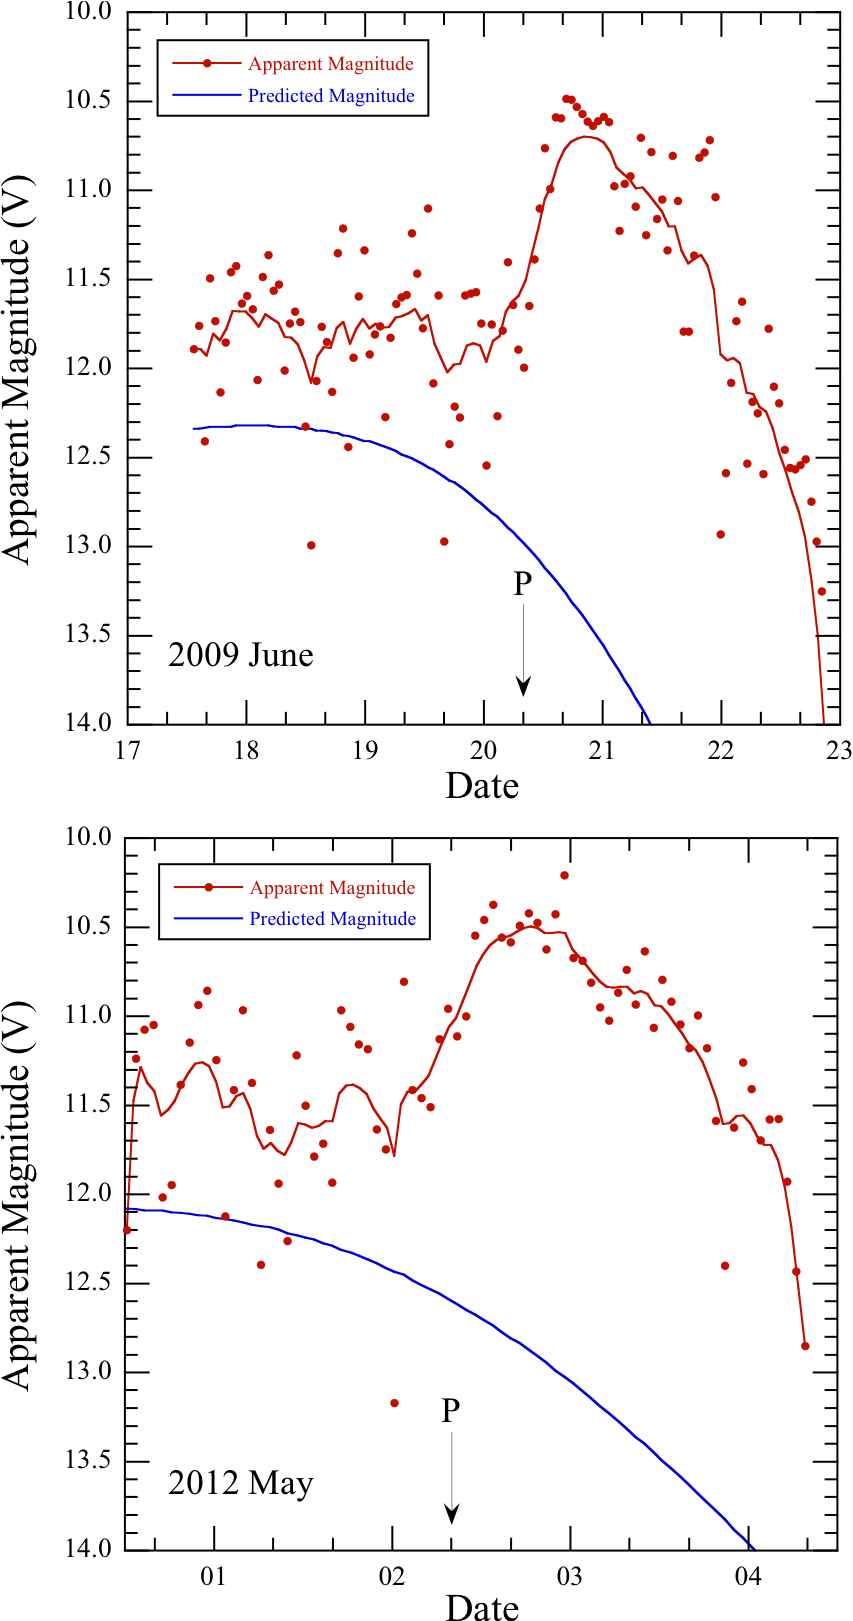
Apparent V magnitude of Phaethon (red circles) in 2009 and 2012. The magnitudes predicted by NASA's ephemeris software are shown for reference (blue lines). Letter ``P'' and arrows mark times of perihelion, date = 20.3 for June 2009 and date = 02.3 for May 2012. The red curve is a smoothed fit to the data added to guide the eye. The time ranges correspond to the valid Phaethon photometry measurements.
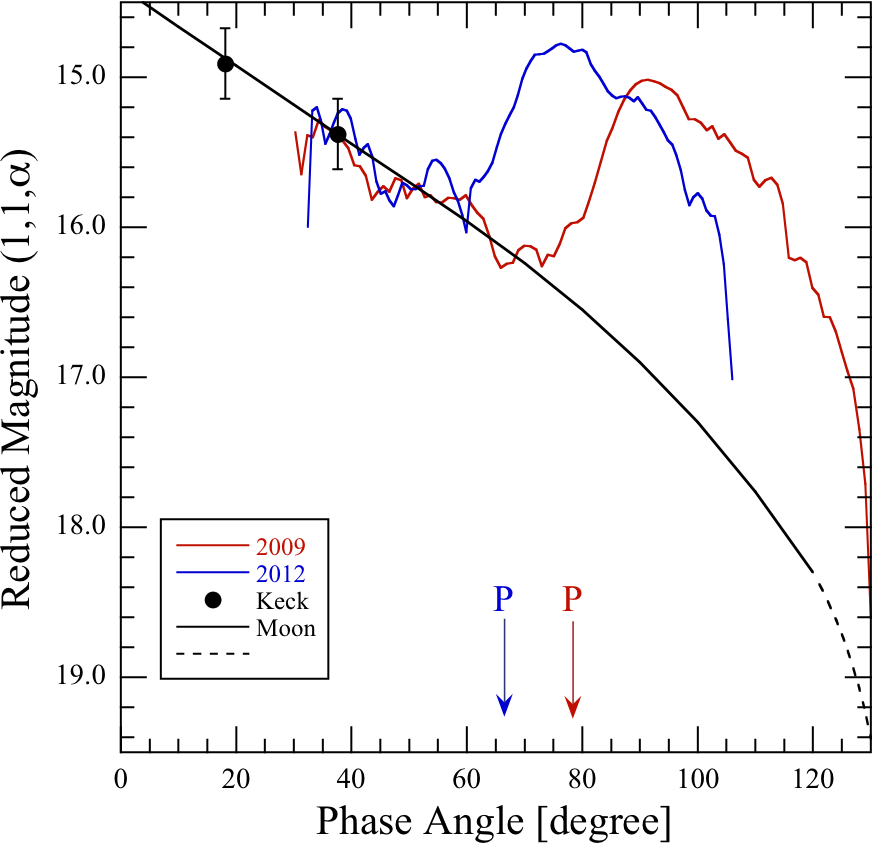
Magnitude at R=∆=1 AU, vs. phase angle (alpha) in 2009 and 2012. The reduced Phaethon magnitudes are plotted in red (2009) and blue (2012) curves, and are smoothed fits to the actual data points. Two Keck data points are from a new measurement in 2012 for m(1,1,18.1˚); and from Hsieh & Jewitt (2005) for m(1,1,37.6˚). The lunar phase function is over-plotted from Lane & Irvine (1973) with the thick solid black curve. For alpha>120˚, the lunar phase function is extrapolated (dashed curve). The letters ``P'' indicate phase angles alpha=79˚ (red) and alpha=66˚ (blue) corresponding to the perihelia in 2009 and 2012, respectively. Note that these perihelia correspond to the starts of the Phaethon brightnesses.
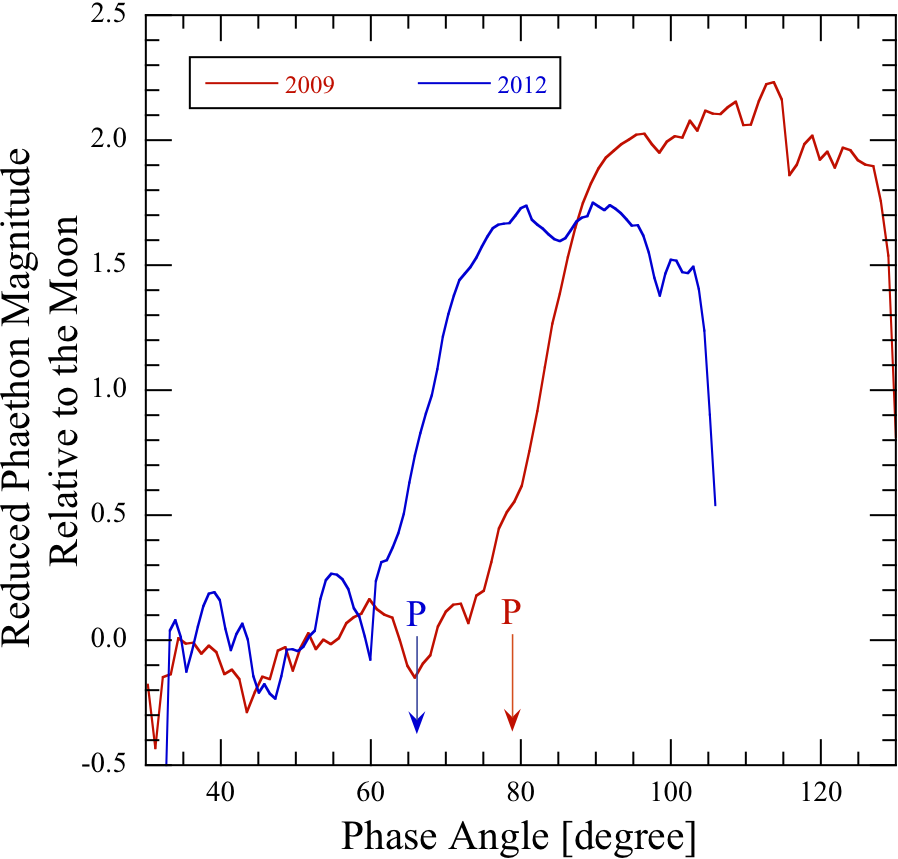
Phase angle dependence normalized to the phase function of the Moon. The phase angles at perihelion are marked with arrows and the letter ``P''.
Flux density as a function of time from photometry (red circles) and the thermal emission (blue curves). The latter is calculated from Equation (\ref{heat}) in 2009 (top) and 2012 (bottom). The perihelia are marked by the letter ``P'' with arrows.
Last updated Thu Apr 4 11:39:41 PDT 2013
Photometry, Magnitude and Flux Densities
Summary
We report new observations of planet-crossing asteroid and Geminid meteoroid parent (3200) Phaethon, using the NASA STEREO solar spacecraft. We find that
-
★(3200) Phaethon exhibited anomalous brightening when at perihelion in 2009 and 2012, but not in 2010 (the latter likely owing to unfavorable observing geometry). The distance-corrected apparent brightness increased near phase angle 100˚ in 2009 and 80˚ in 2012, in both years ~0.5 day after perihelion passage. This brightening lies in stark contrast to the monotonic fading expected from phase darkening on a macroscopic body.
-
★The most direct interpretation is that Phaethon brightens because of a sudden increase in the scattering cross-section due to the ejection of dust with a mass M_d ~4x10^8 a_mm kg, where a_mm is the effective dust radius in millimeters. A contribution from prompt emission by atomic oxygen cannot be excluded.
-
★Thermal fracture and the decomposition of hydrated silicates are two plausible mechanisms of dust production at the ~1000 K surface temperatures attained near perihelion. Both are difficult to quantify in the absence of more detailed information about the composition of Phaethon.
-
★Phaethon has only very limited visibility in the STEREO field of view (typically ≤5 days per orbit). The detection of anomalous brightening twice in two favorable observing windows suggests that this phenomenon is common.
