1D Hybrid Results
1/17/2006
return to index page
Simulation results of zero-ing out the positive or negative helicity L mode waves.
Test case:
- sulfur maxwellian core, isotropic, Tperp=Tpar= 100 eV
- sulfur ring, vr = 57 km/s, thermal spread of ring with Tpar= 5 eV
run parameters:
ntimes=1600
dtwci=0.05D0
nx=128
xmax=40.0D0
wpiwci=3.074252D3
nsp=2
nspec(1)=40960
nspec(2)=40960
vbspec(1)=0.0D0
vbspec(2)=0.0D0
dnspec(1)=0.8D0
dnspec(2)=0.2D0
btspec(1)=0.0630D0
btspec(2)=0.00310D0
anspec(1)=1.0D0
anspec(2)=107.0D0
wspec(1)=1.0D0
wspec(2)=1.0D0
bete=1.0D-4
resis=0.0D0
theta=0.0D0
iemod=0
spatial step = 0.3125 c/wpi; total particles per cell = 640; run time = 80 Omega_i*t
Three runs are done to see the effect of only allowing either the positive or negative helicity mode to grow:
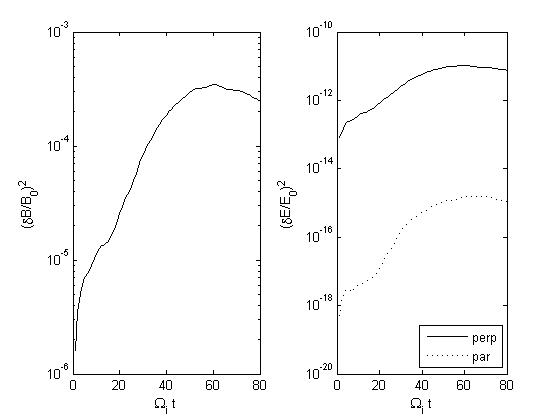
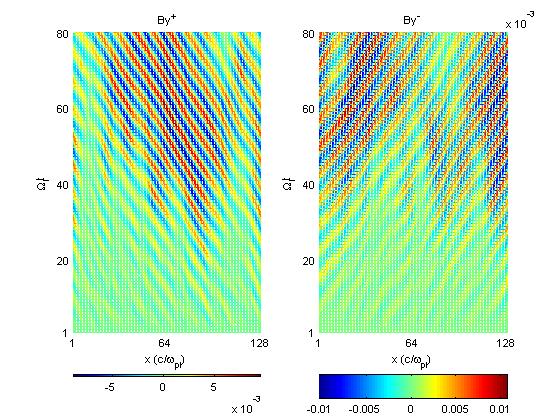
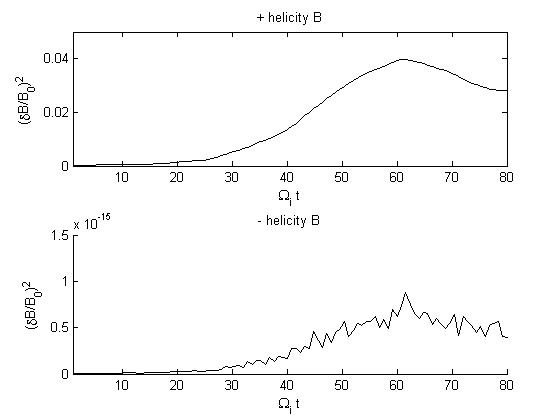
Run 1: Both modes allowed to grow (notice that the negative helicity modes have higher growth rate and energy)
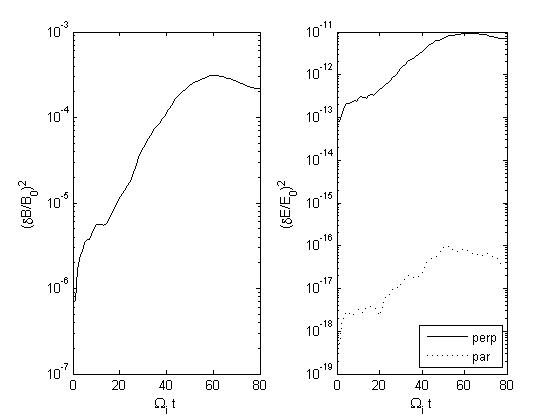
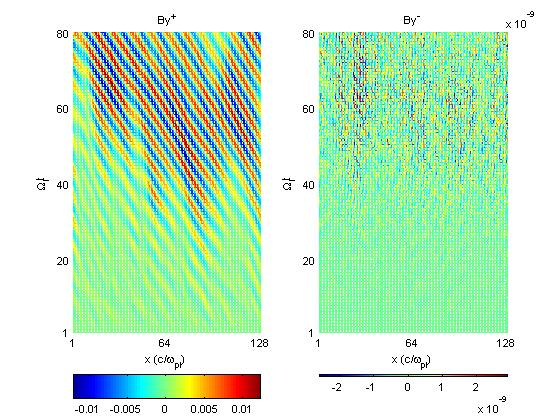
Run 2: Only positive modes allowed to grow
Run 3: Only negative modes allowed to grow
Discussion: If the difference in the growth rates of the helicities is due to their mutual interaction, then removing one or
the other should allow the other to grow unrestricted. In this case, they should both show the same growth rates and energies
in Runs 2 and 3. However they are not the same (it's closer than in Run 1), implying there is something else which is causing the effect; their growth
rates and energies are higher than in Run 1, suggesting there is some interaction, but it is not the underlying cause. Just as
the negative helicity modes had higher growth rate and energy than the positive modes in Run 1, they are still higher in Run 3
than the positive modes are in Run 2.
Figs (a) show the time series of the fluctuating total magnetic and electric energy density
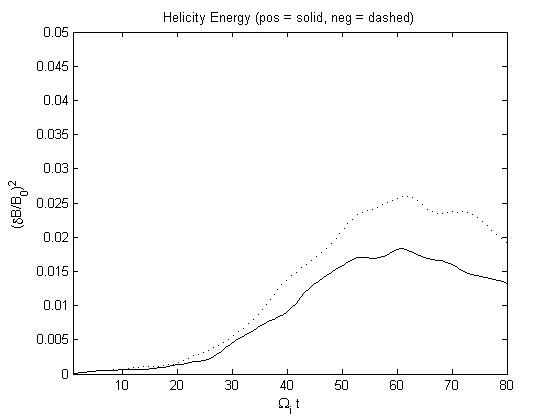
Figs (b) show the time series of the fluctuating magnetic energy of positive and negative helicity components
Figs (c) show a mesh plot of the amplitude (color) of the positive and negative helicity components across the simulation axis over time.
Growth rates for the B field are as follows (overall growth rate is determined from Figs (a); helicities from Figs (b); ) :
Run 1: overall = 0.065; positive helicity = 0.058; negative helicity = 0.068
Run 2: overall = 0.067; positive helicity = 0.067; negative helicity ~ 0
Run 3: overall = 0.073; positive helicity ~ 0 ; negative helicity = 0.073
Run 1: Run2: | Run 3: | | |
Fig1a
 | Fig2a
 | Fig3a
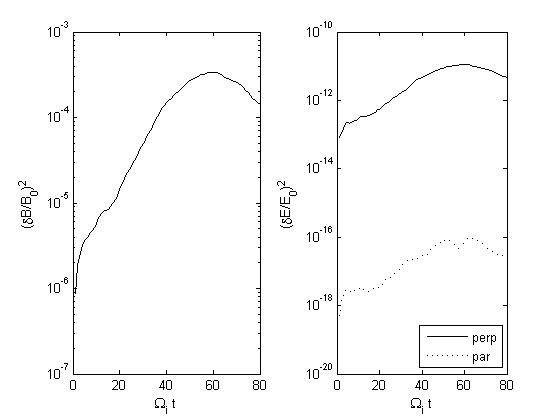 |
Fig1b
 | Fig2b
 | Fig3b
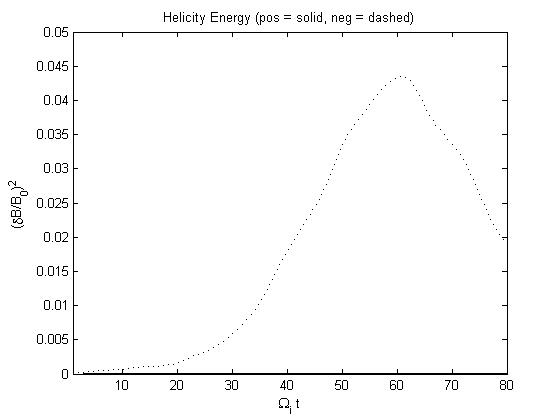 |
Fig1c
 | Fig2c
 | Fig3c
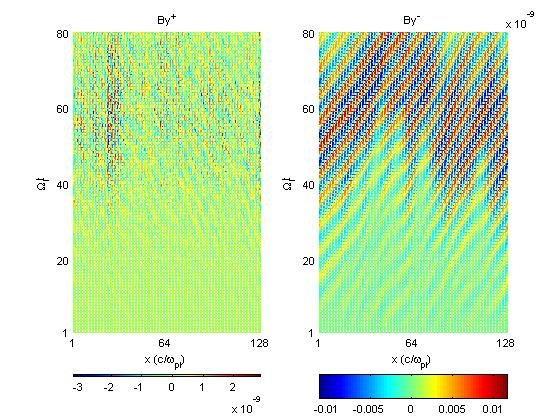 |
Fig 4. Example that the negative helicity is not completely removed in this technique.
return to index page


