(red = background fixed, black = beam injected)
Fig 1

Fig 2
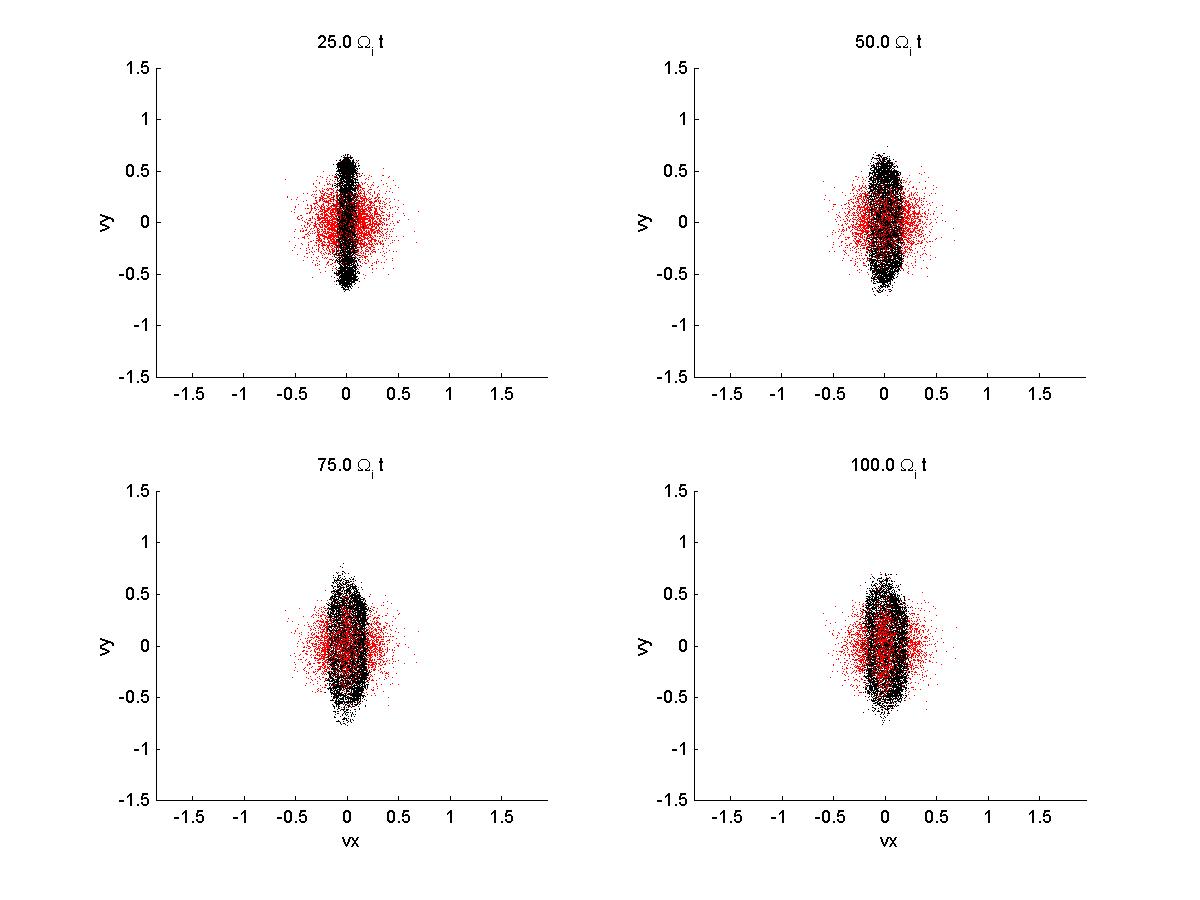
Fig 3
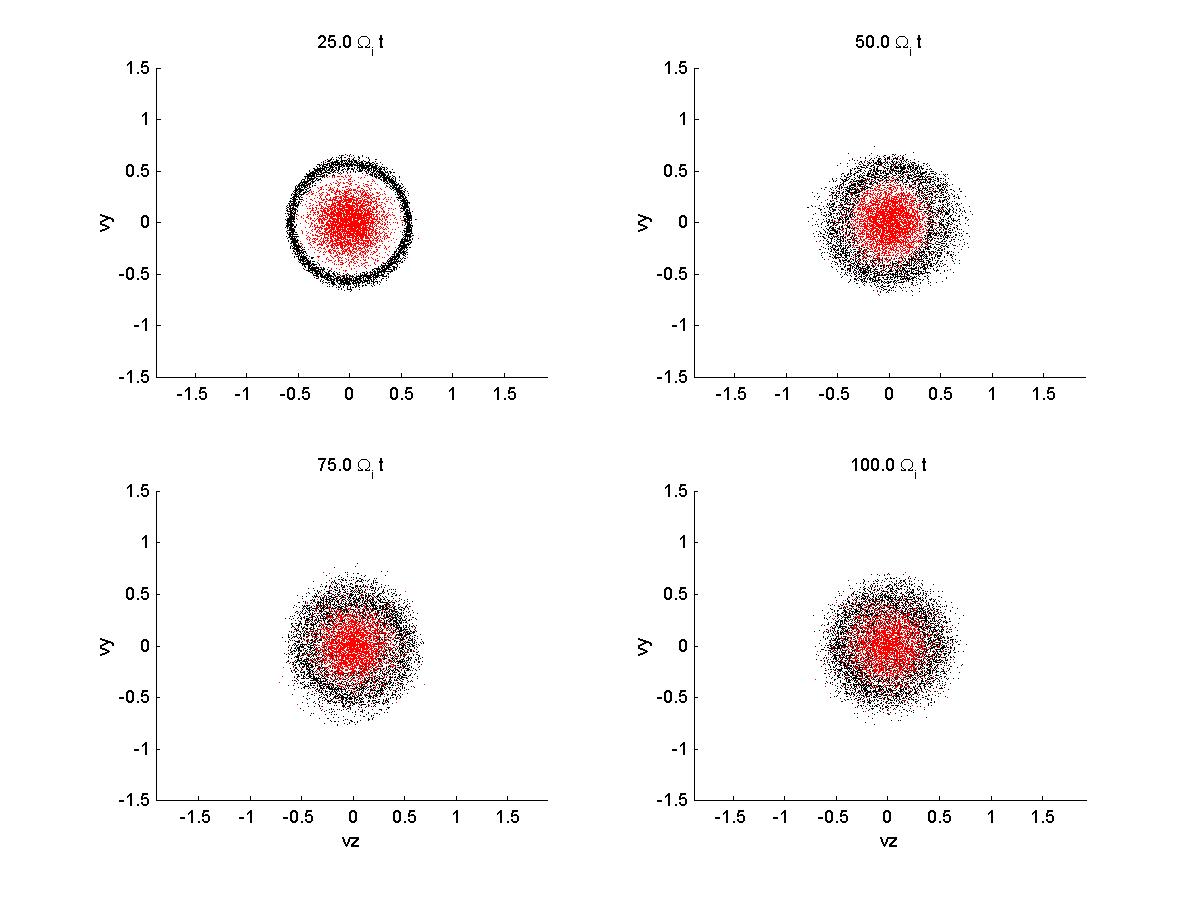
Fig 4
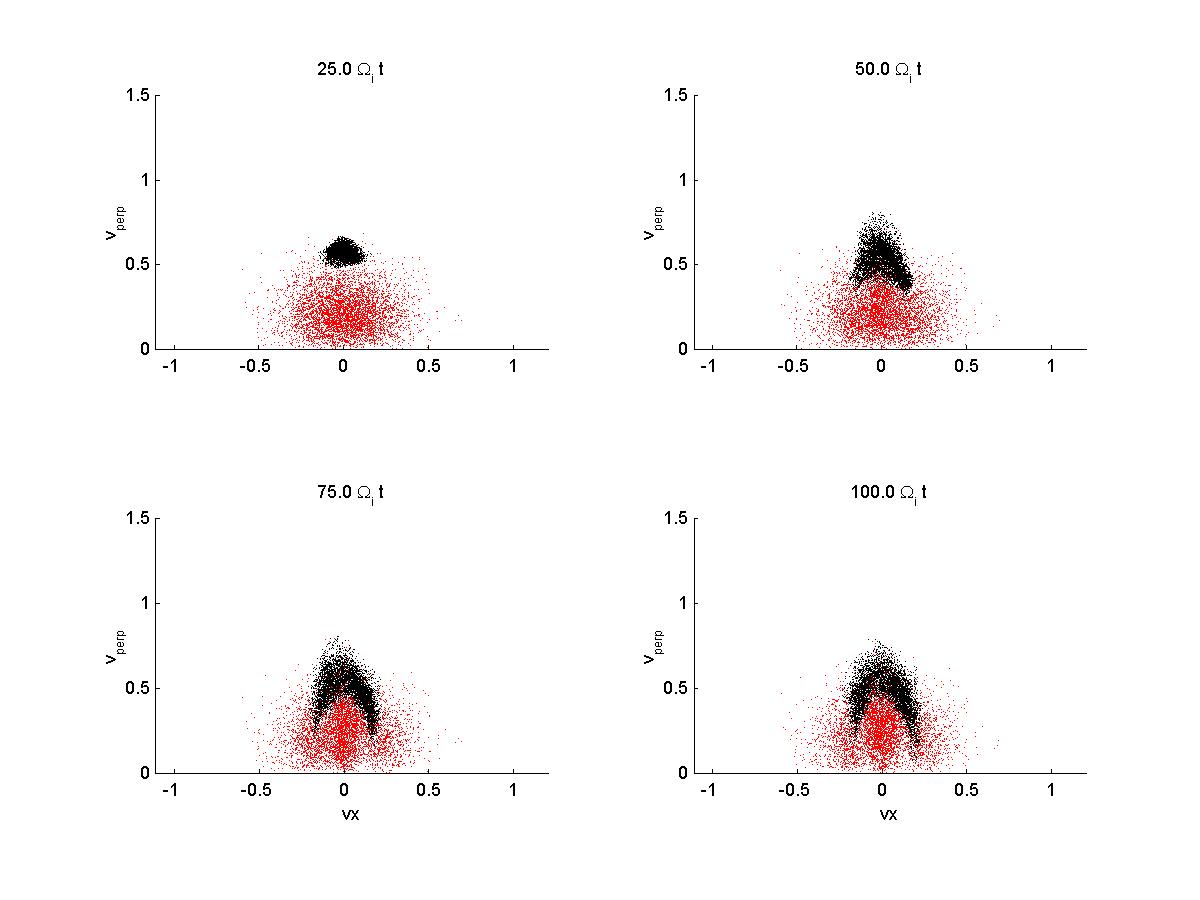
Fig 5
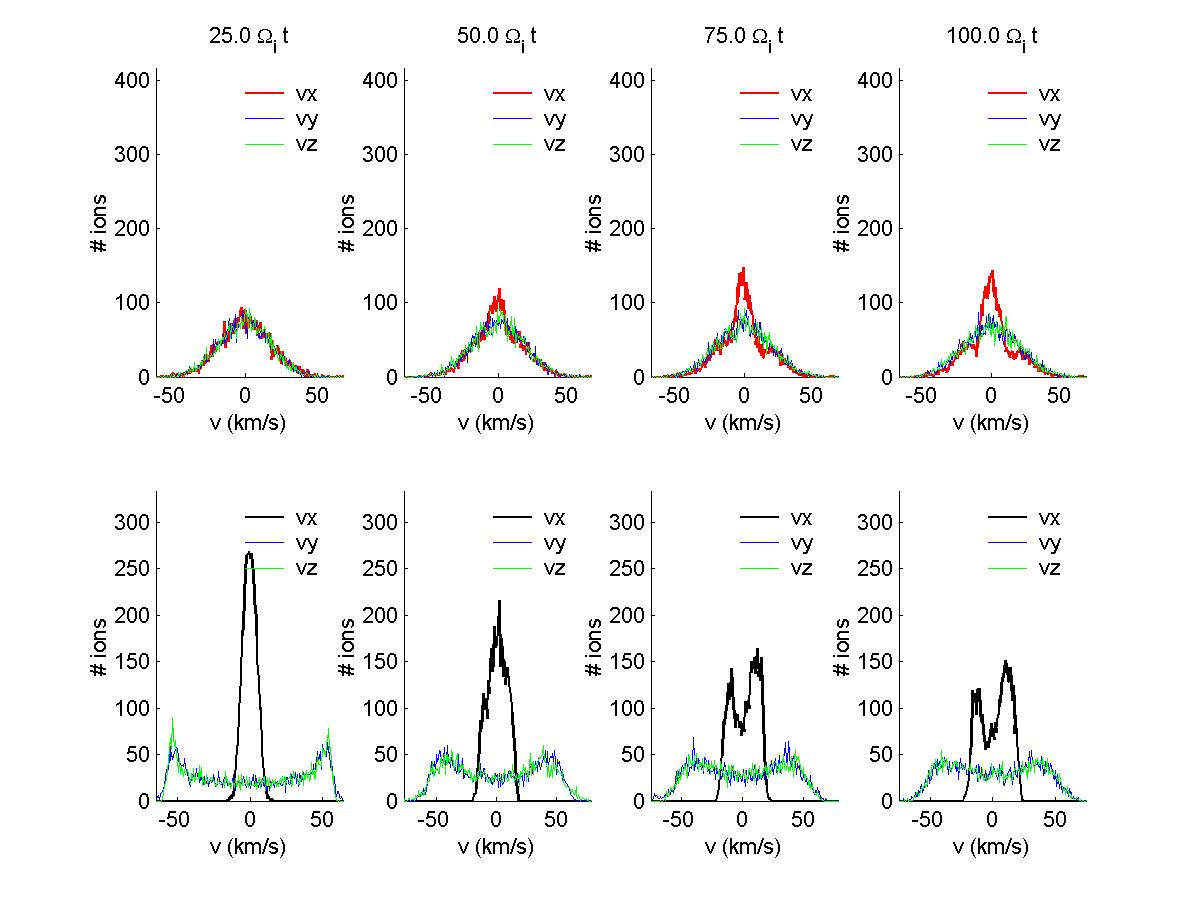
Fig 6
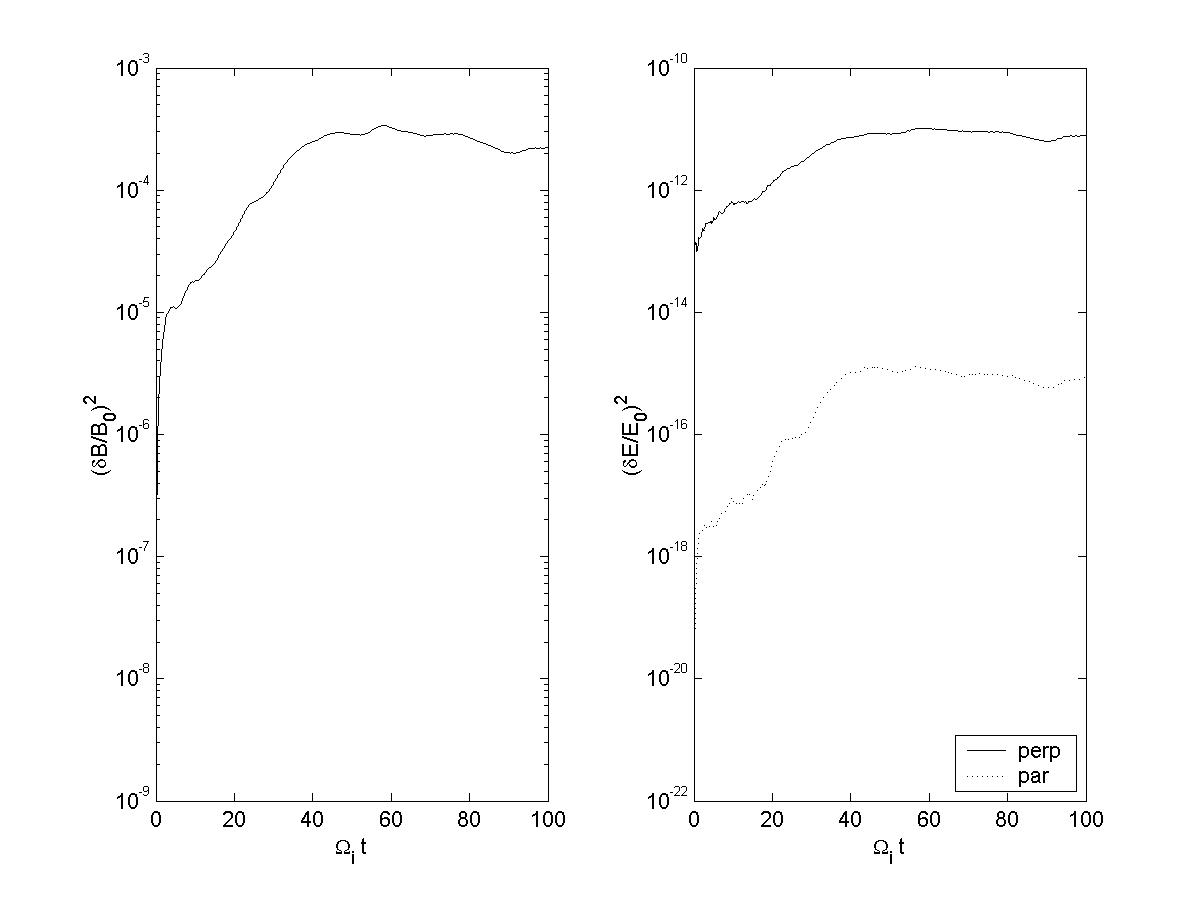
Fig 7
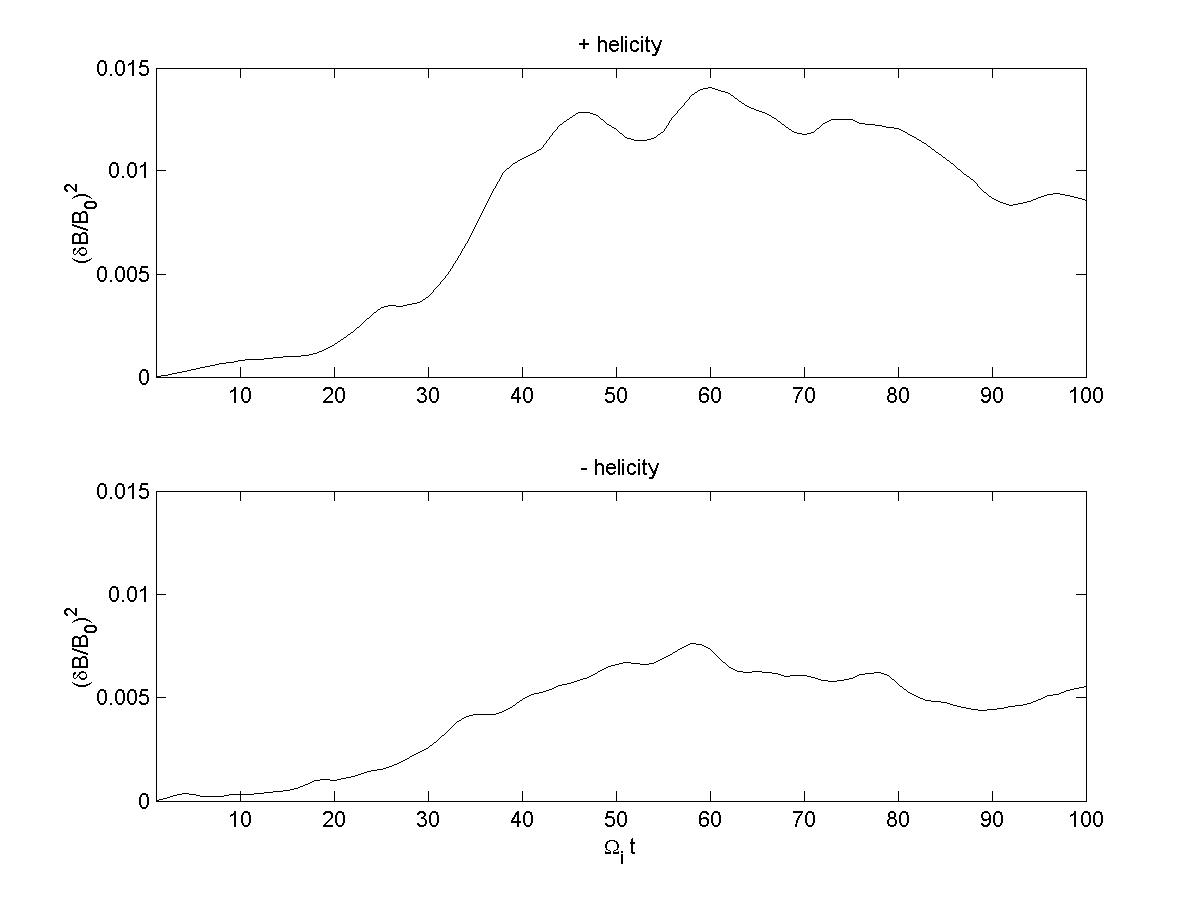
Fig 8
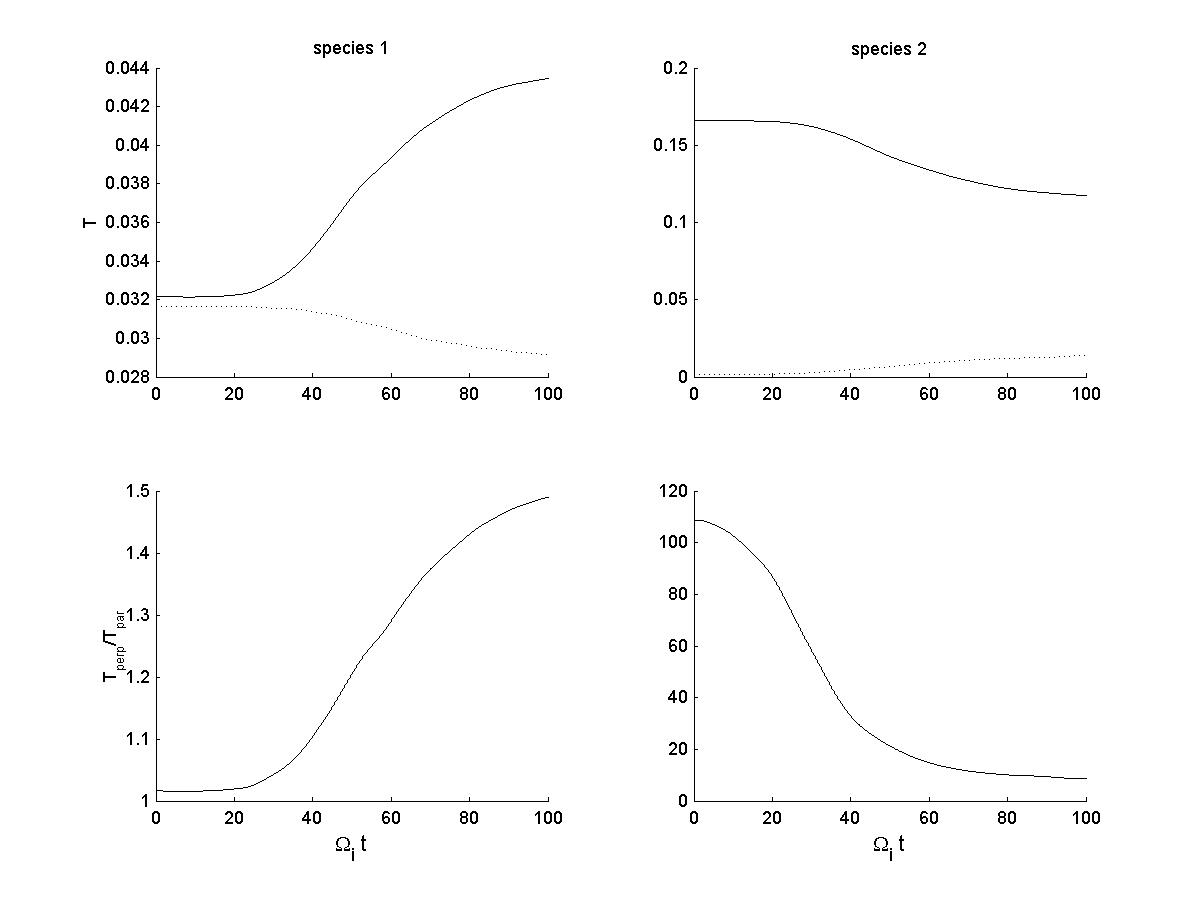
Fig 9
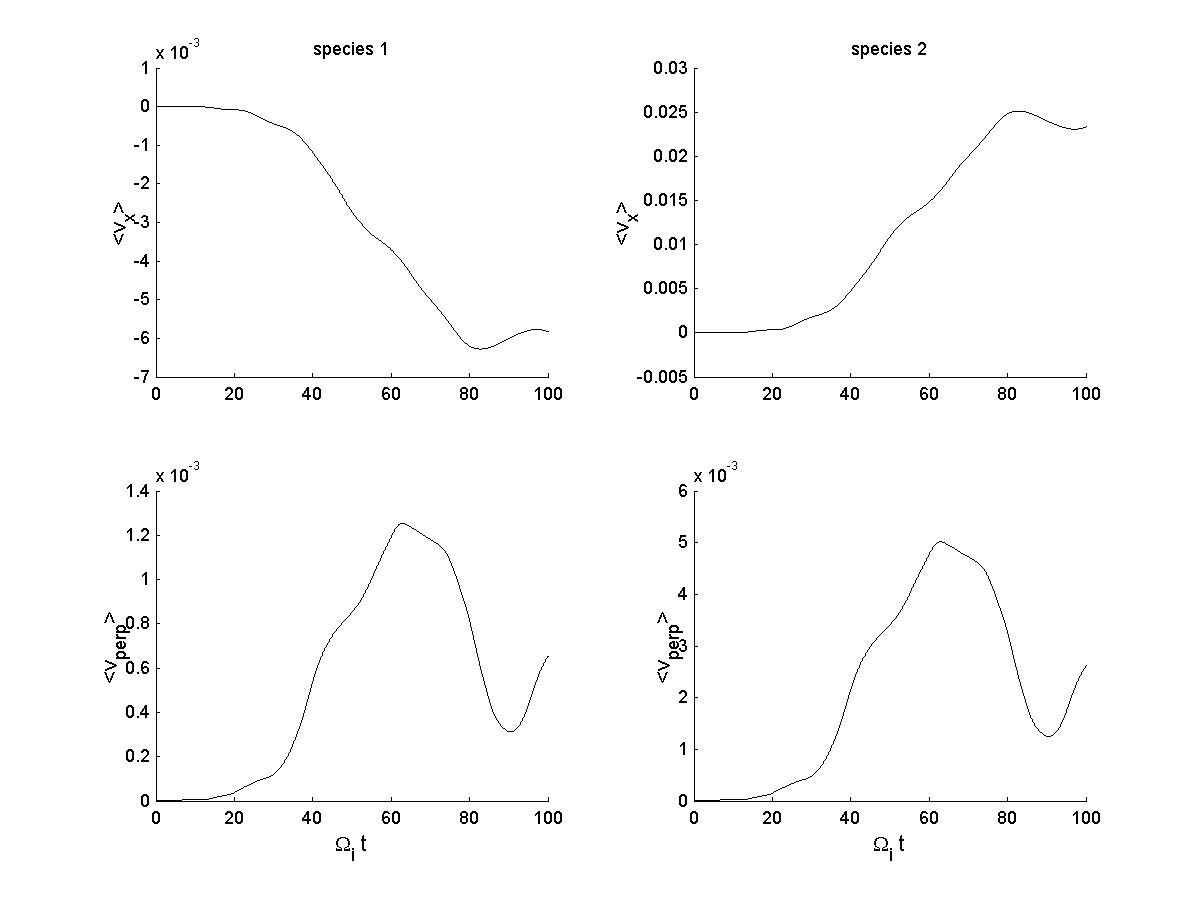
Fig 10
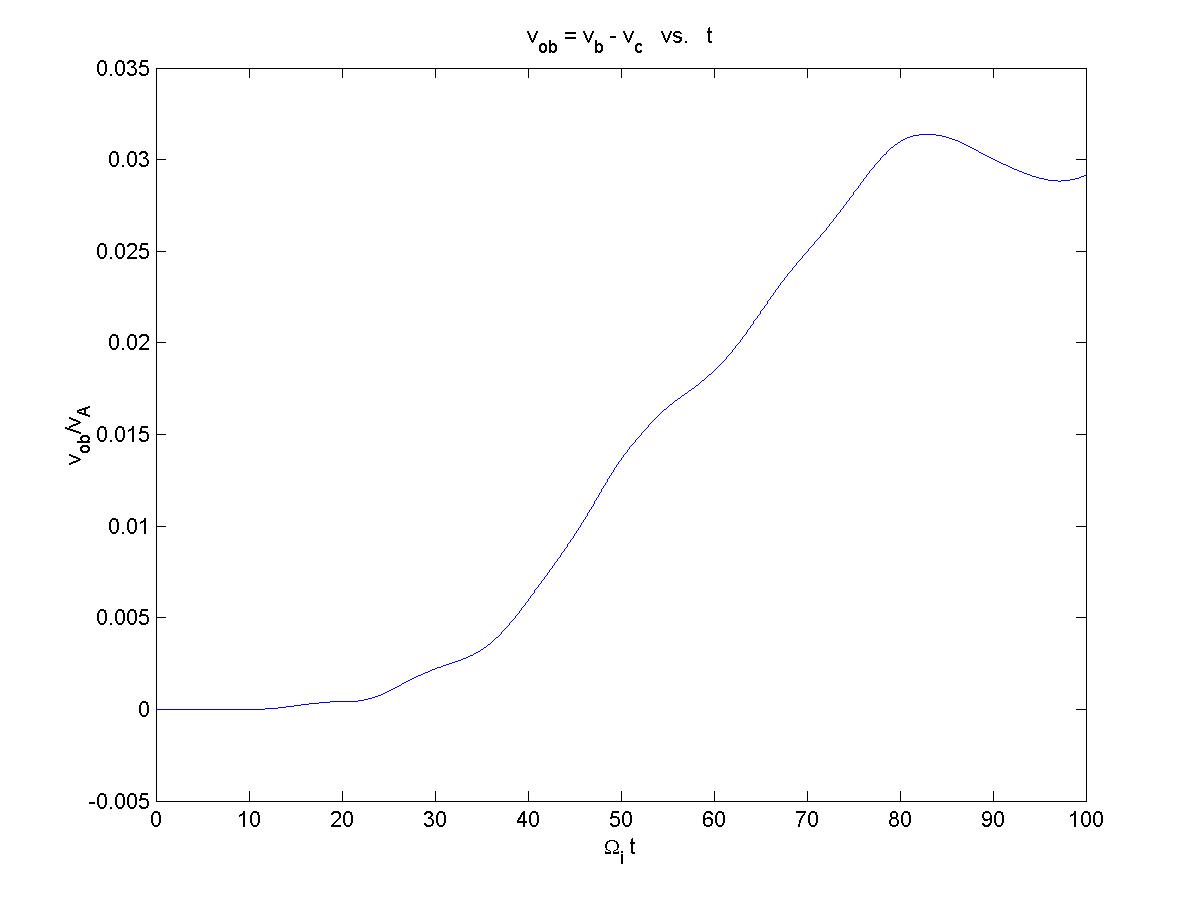
Fig 12
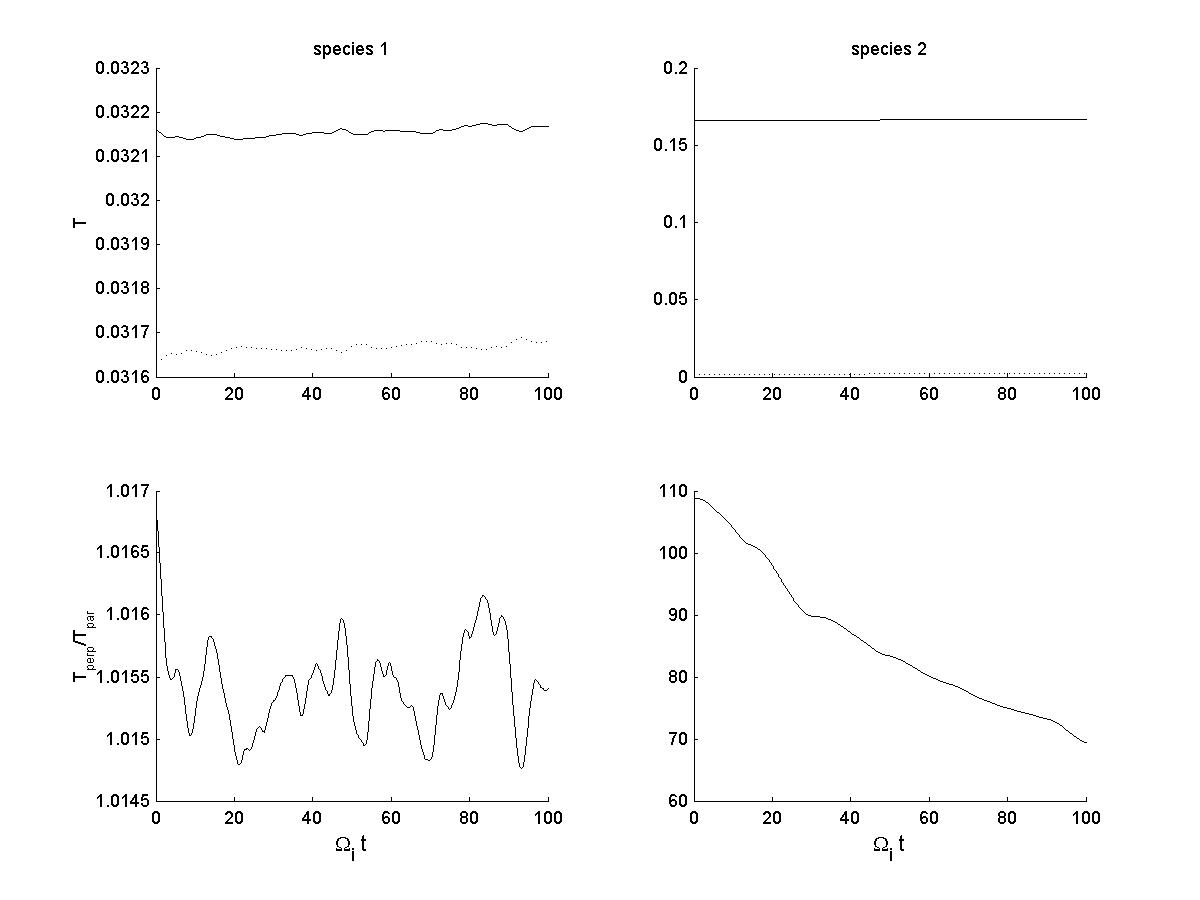
Fig 11

Fig 13

return to index page
Simulation results of the asymmetry problem are shown below.
Test case:
|
Initial velocity distribution (red = background fixed, black = beam injected) Fig 1
|
|
Velocity Space
Fig 2
|
|
Velocity Space
Fig 3
|
|
Velocity Space
Fig 4
|
|
Velocity Space (core is top, beam is bottom)
Fig 5
|
|
B and E field energy
Fig 6
|
|
Helicity components energy
Fig 7
|
|
Temps (normalized to simulation units)
Fig 8
|
|
Average velocities (normalized to simulation units)
Fig 9
|
|
Relative drift velocity (vd = avg(vx_beam) - avg(vx_core))
Fig 10
|
|
Numerical heating temps
Fig 12
|
|
Numerical heating average velocities
Fig 11
|
|
Numerical heating relative drift velocity
Fig 13
|
return to index page